
When purchasing a industrial grinder for production tests or selling finished powder products, powder fineness is always the core evaluation standard. In the powder processing industry, most people describe powder quality simply by mesh size, such as 30-mesh, 80-mesh, or 200-mesh. However, this traditional description is inaccurate and unprofessional for commercial and industrial quality control.
If you want to accurately define powder quality, you must learn to read a particle size analysis report. There are two mainstream fineness testing methods in the industry: vibrating sieve screening and laser particle size analysis. Understanding these two testing systems will help you better evaluate the performance of industrial spice grinders, industrial wheat grinders, air classifying mills,hammer mills, and pin mills, and effectively control your final powder quality.
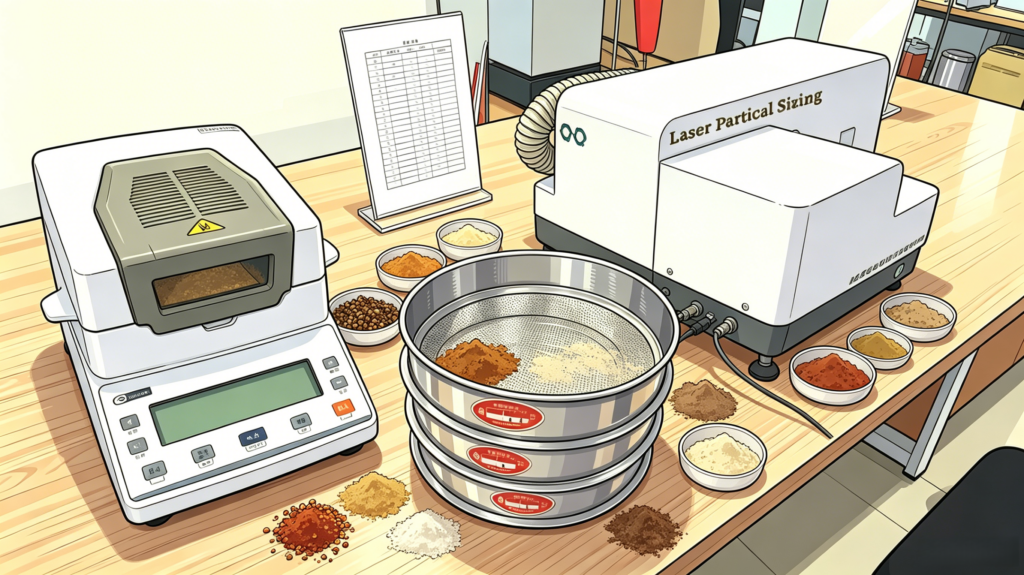
1. Vibrating Sieve Test: The Basic Fineness Judging Method
Vibrating sieves or manual hand sieves are widely used for testing coarse and medium-fine powder. They are the most common on-site testing tools during machine trial runs for industrial spice grinders and ordinary industrial grinders.
The testing logic is straightforward. Take 100g of crushed powder and screen it with a standard mesh sieve. For example, if 10g of powder remains on a 30-mesh sieve, it means 90% of the powder passes through 30-mesh. In professional terms, we define it as D90 = 30 mesh.
Similarly, if only 5g remains on a 40-mesh sieve after screening the same batch, we can confirm D85 = 40 mesh.
This explains why a professional particle size result contains multiple data points instead of a single mesh value. During customer tests, our technicians always use multiple sieves to record complete particle size data, ensuring objective and reliable fineness performance of the industrial grinder.
However, sieve screening has obvious limitations. For ultra-fine powder above 150-mesh, 200-mesh or 300-mesh, the mesh aperture is too small for effective screening. At this stage, a laser particle size analyzer becomes the only reliable testing solution.
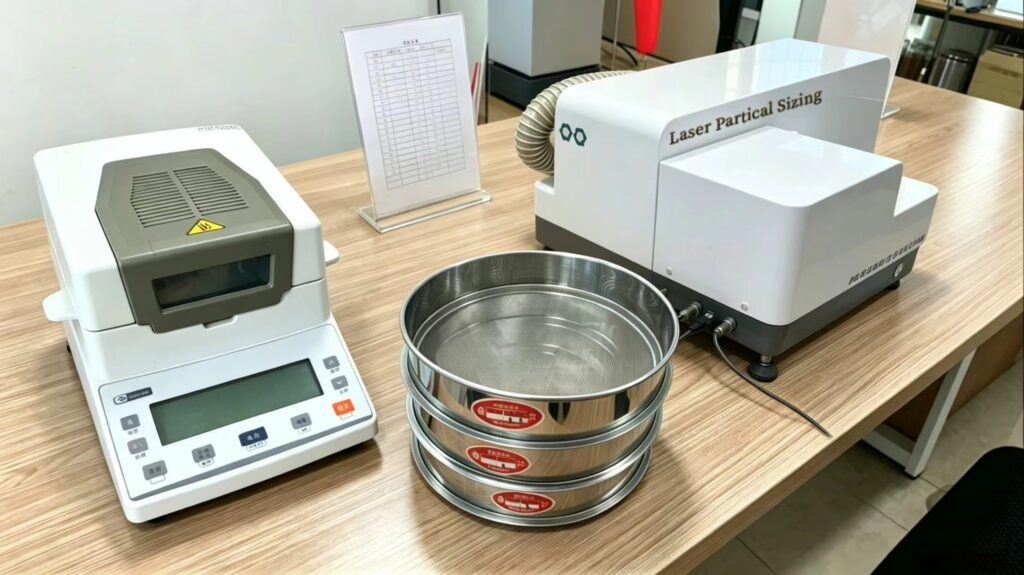
2. How to Read Laser Particle Size Analysis Reports
Laser particle size testing is the standard detection method for ultra-fine powder produced by air classifying mills and ultra-fine pulverizers. Many customers feel confused about the curves and data tables, so we explain the professional parameters with our actual test case.
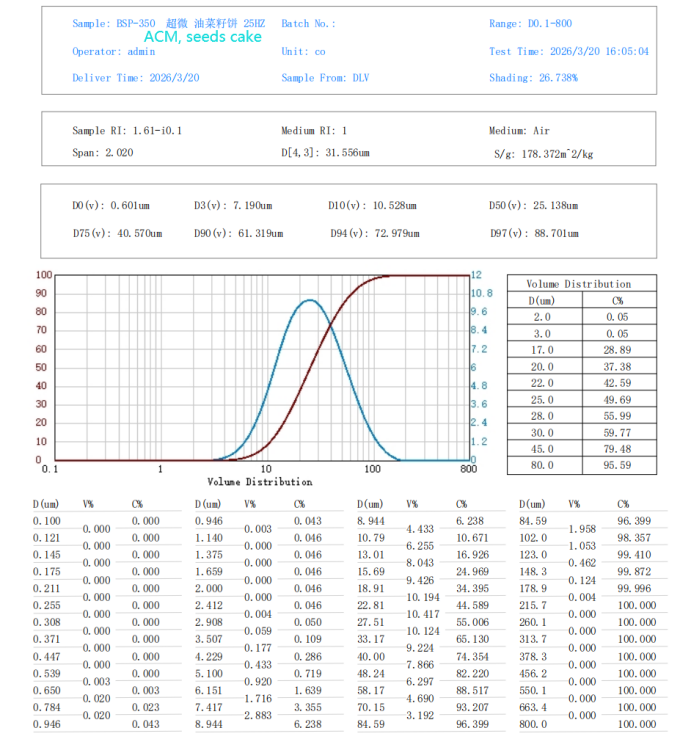
In one of our real trials, we processed seed cake powder with our BSP-350 air classifying mill at a classifier frequency of 25Hz. The laser test report shows clear and representative data:
D50 = 25.138μm: This means 50% of the powder particles are finer than 25.138μm, representing the average particle size of the whole batch.
D97 = 88.701μm: This indicates 97% of all powder particles are finer than 88.701μm, which is the key index for evaluating maximum particle size and oversize rate.
The detailed data table contains three core columns:
- D (μm): Particle diameter, referring to the specific particle size range
- V (%): Volume percentage, the volume proportion of particles in this specific size range
- C (%): Cumulative volume percentage, the total proportion of all particles from the finest size to the current size
According to the cumulative data, we can conclude that approximately 99.4% of the powder is finer than 123μm, which fully reflects the precise classification capability of our air classifying mill.
What Does the Particle Size Distribution Curve Mean?
You do not need to analyze every data point of the curve. The steepness of the curve directly reflects powder uniformity:
- Steep curve: Particles are concentrated in a narrow size range, uniform fineness, stable and high-quality powder
- Gentle curve: Particle span is wide, coarse and fine powder mixed unevenly, poor consistency
Most powder processed by air classifying mills, ultra-fine grinders and jet mills presents a standard single-peak curve with narrow distribution and good uniformity.
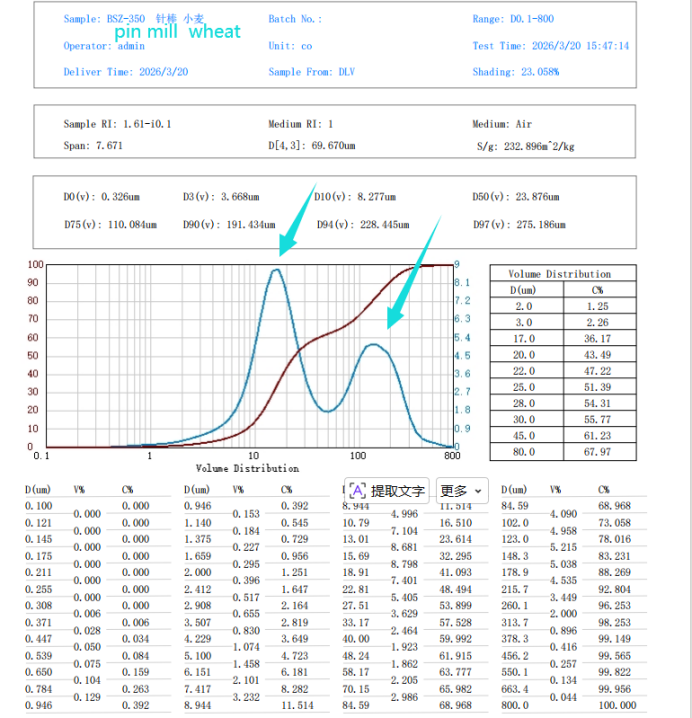
3. Double-Peak Particle Size Curve: Normal Phenomenon for Wheat Milling
While most grinding equipment produces single-peak particle size distribution, some tests show double-peak curves, which is often mistaken for equipment failure. Taking our BSZ Contraplex pin mill processing wheat as an example, the double-peak distribution is a typical and normal feature of wheat milling, not a machine error.
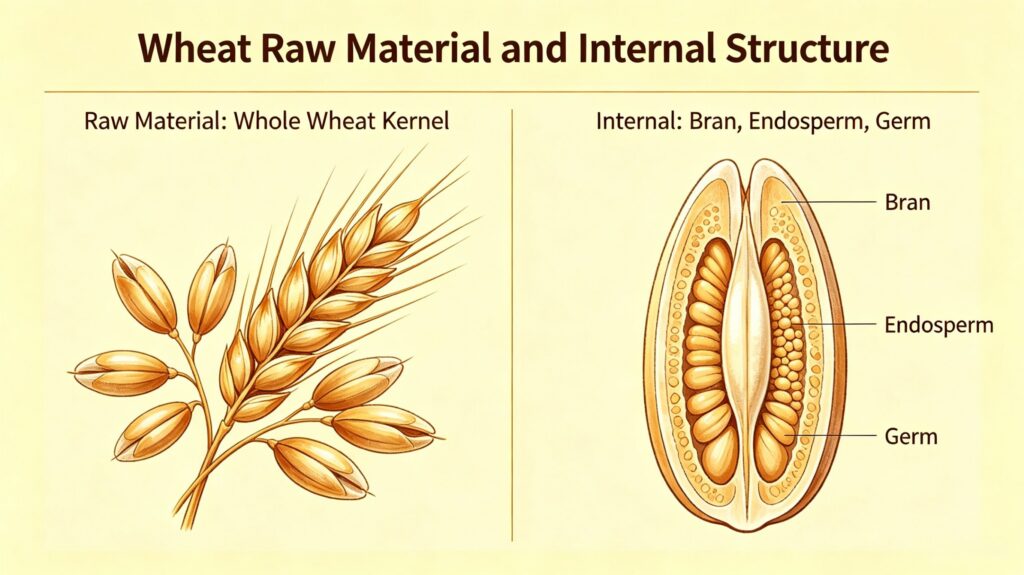
Wheat grains consist of three completely different structural parts with distinct physical properties:
- Endosperm: Crisp and easy to crush, forming fine particle peaks
- Bran: High fiber content, tough and ductile, hard to pulverize, only torn into coarse flakes, forming coarse particle peaks
- Germ: Special texture that affects partial particle distribution
This is why professional industrial wheat grinders using pin mills always produce double-peak powder. In fact, the double-peak feature is extremely valuable for high-value wheat powder processing.
Industrial Value of Double-Peak Particle Size
Wheat has a fixed nutrient distribution rule: high protein on the outside, high starch on the inside.
- Bran and outer layer: High fiber, medium protein, high ash content
- Aleurone layer: The highest protein content (18–24%) and rich in minerals
- Inner endosperm: Mainly starch, low protein (6–12%)
Therefore, the two peaks correspond to two completely different powder components:
- Coarse peak (100–500μm): Mainly bran and fiber fragments
- Fine peak (10–60μm): High-protein aleurone layer and pure endosperm powder
The double-peak distribution provides a natural sorting signal. Factories can separate coarse and fine powder through wind classification and screening to obtain high-protein wheat powder.
In contrast, processing wheat with an ACM air classifying mill produces only a single-peak curve. All bran and endosperm are crushed and mixed evenly, making protein separation impossible. This clearly explains why some customers choose pin mills while others prefer air classifying mills — different equipment matches completely different product positioning.
4. Industry Differences in Particle Size Requirements
Different industries have vastly different standards for particle size distribution:
Chemical industry: Extremely strict requirements for particle size uniformity and distribution span. Particle size analysis reports are mandatory for production and quality inspection.
Food industry: Relatively loose standards for common materials, but high-end spices and specialty flour still require precise particle size control to ensure taste and storage stability.
5. Professional Particle Size Optimization & Custom Milling Tests
Reading particle size reports is the foundation of quality control, while optimizing particle size distribution is the core of improving powder competitiveness. BRIGHTSAIL has rich experience in particle size adjustment and powder optimization for various materials.
Perfect powder fineness and uniform distribution cannot be achieved through a single test. In most cases, our technical team conducts multiple repeated milling tests, adjusting classifier frequency, rotor speed, feeding rate, and airflow parameters step by step. Continuous debugging ensures the final particle size, uniformity and distribution fully meet customer industrial standards.
6. Conclusion
Simply describing powder by mesh size is no longer sufficient for industrial production. Learning to read vibrating sieve data and laser particle size analysis reports helps you accurately judge machine performance and powder quality.
Whether you need industrial spice grinders, industrial wheat grinders, hammer mills, pin mills, or air classifying mills, BRIGHTSAIL provides professional material testing, repeated particle size optimization, and free particle size analysis reports. We help every customer select the most suitable equipment and process solutions to achieve stable, high-quality powder production.


